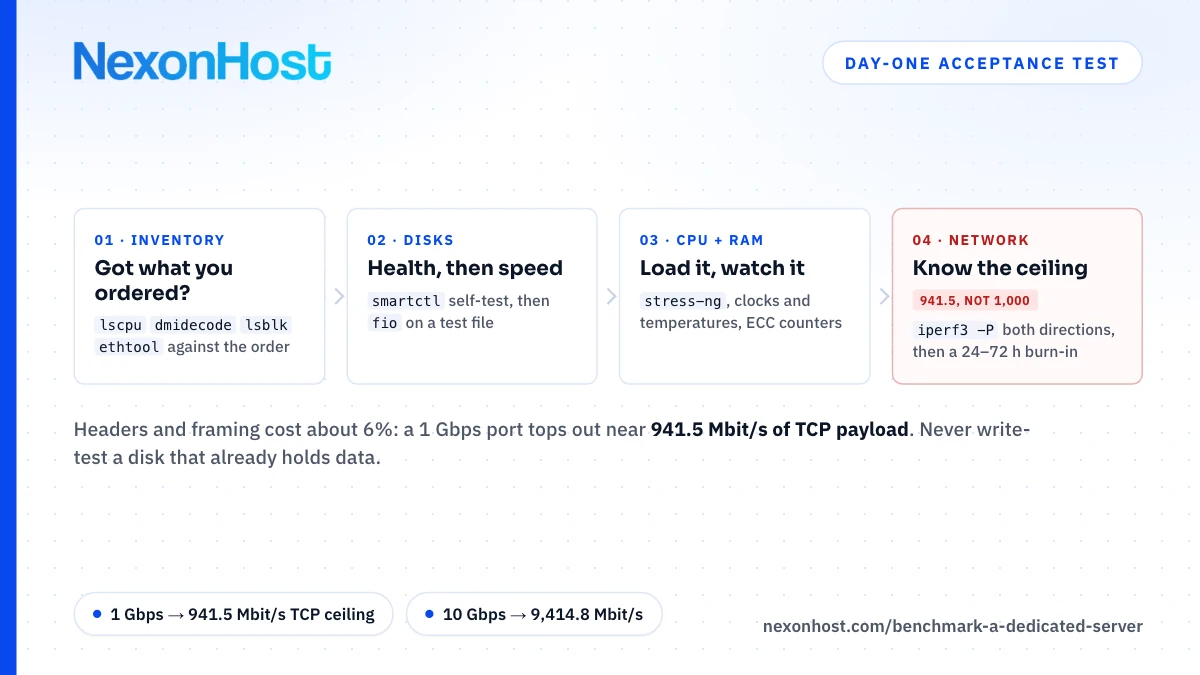
The day a new server arrives is the cheapest day to find a fault: nothing runs on it, and a part can be swapped without a migration. This is how to benchmark a dedicated server as a first-day acceptance test: check the hardware matches the order, the disks and memory are healthy, the port delivers its rated speed, and the machine survives a day of full load. Every "good" result is defined against the spec you bought. This post publishes no NexonHost results; measure your own server.
Before you start
Do the new server security checklist first. Then install the tools (Debian and Ubuntu names):
sudo apt install fio iperf3 smartmontools nvme-cli sysbench stress-ng lm-sensors rasdaemon dmidecode ethtool tmux
turbostat is packaged separately: linux-cpupower on Debian, linux-tools-common plus linux-tools-$(uname -r) on Ubuntu. Run long tests inside tmux so an SSH drop does not kill them, and save every output to a file.
1. Inventory: does the hardware match the order
lscpu | grep -E 'Model name|Socket|Core|Thread'
sudo dmidecode -t memory | grep -E 'Size|Speed|Locator'
lsblk -d -o NAME,MODEL,SIZE,ROTA,TYPE
sudo nvme list
ip -br link
sudo ethtool eno1 | grep -E 'Speed|Duplex|Link detected'
Replace eno1 with your interface name. Check against the order:
- CPU: model, sockets × cores, threads per core.
- Memory: populated
Sizelines add up to the RAM you bought. CompareConfigured Memory Speedwith the processor's supported speed, tabulated per build in Xeon vs EPYC. - Disks: count, size, model;
ROTAis 0 for SSDs. Two disks in RAID 1 showing as one device usually means a hardware RAID controller; with software RAID,cat /proc/mdstatshows both members. - Network:
ethtoolshows the link speed negotiated with the switch, which can be higher than the port speed you bought. iperf3 measures what the port delivers.
2. Disk health: read SMART before writing anything
sudo smartctl -x /dev/sda
sudo smartctl -a /dev/nvme0
The smartctl manual no longer recommends -a for ATA disks; use -x for SATA. A failing health status, it says, means the disk has failed or predicts its own failure within 24 hours. Behind a hardware RAID controller, add the controller's type per disk, such as -d megaraid,0.
For NVMe, smartctl reads the SMART / Health Information log, whose fields the NVMe Base Specification defines:
- Critical Warning should be 0 (its bits flag low spare, temperature, degraded reliability, read-only media).
- Available Spare should be above Available Spare Threshold.
- Percentage Used is the vendor's estimate of endurance consumed.
- Media and Data Integrity Errors counts unrecovered errors such as uncorrectable ECC.
- Power On Hours and Data Units Written show the work already done.
Start a long self-test on each disk (sudo smartctl -t long /dev/sda; results via smartctl -l selftest). NVMe self-tests need smartctl 7.4 or later; on older releases use sudo nvme device-self-test /dev/nvme0 -s 2, then sudo nvme self-test-log /dev/nvme0.
3. Disk performance with fio
Two fio jobs against a test file: small random reads (databases) and large sequential reads (backups, media):
df -h /root
fio --name=rand4k --filename=/root/fio.test --size=8G --direct=1 --ioengine=libaio --rw=randread --bs=4k --iodepth=32 --numjobs=4 --runtime=60 --time_based --group_reporting
fio --name=seq1m --filename=/root/fio.test --size=8G --direct=1 --ioengine=libaio --rw=read --bs=1M --iodepth=16 --numjobs=1 --runtime=60 --time_based
rm /root/fio.test
Per the fio documentation, --direct=1 uses non-buffered I/O (O_DIRECT); without it you measure RAM, and libaio may only queue I/O when buffering is off. --iodepth=32 keeps 32 I/Os in flight per job, which is how SSDs reach rated IOPS; at depth 1 you measure latency.
Compare IOPS from the 4k job and bandwidth from the 1M job with the datasheet for the drive model smartctl reported.
To test writes, keep the same file and change --rw=randread to --rw=randwrite: fio then overwrites only fio.test.
Warning: never run a write job (--rw=write, randwrite, rw or randrw) against a raw device such as /dev/nvme0n1 or /dev/sda that holds data. It overwrites everything, partition table included. fio aborts writes to what looks like a mounted device unless allow_mounted_write is set; an unmounted RAID member gets no such protection. To read a raw device, add --readonly, which blocks writes and trims.
4. CPU, memory and thermals
sysbench gives a repeatable baseline:
sysbench cpu --threads=$(nproc) --time=60 run
sysbench memory --threads=$(nproc) --memory-block-size=1M --memory-total-size=200G run
The scores only mean something against your own later runs. More useful: does the CPU hold its clock under sustained load? Watch from a second terminal:
stress-ng --cpu 0 --timeout 15m --tz --metrics-brief
sudo turbostat --quiet --show Busy%,Bzy_MHz,PkgTmp,PkgWatt --interval 10
sensors
--cpu 0 starts one worker per CPU. turbostat's Bzy_MHz is the clock while busy, PkgTmp the package temperature; if a column is missing on your CPU, use sensors. A steady clock at or above the base frequency is normal; a clock that sinks as the temperature climbs points at cooling.
The Linux EDAC subsystem counts corrected and uncorrected ECC errors per memory controller:
grep . /sys/devices/system/edac/mc/mc*/ce_count /sys/devices/system/edac/mc/mc*/ue_count
Both should stay 0; if the path is missing, no EDAC driver is loaded and these counters are not available. rasdaemon logs these events: sudo ras-mc-ctl --summary up to release 0.8.5, sudo ras-mc-ctl db --summary after. Memtest86+ runs instead of the OS, so it needs console access.
5. Network: why 1 Gbps shows about 941 Mbit/s
Run iperf3 -s on a machine you control (open TCP 5201 for the test), then from the new server:
iperf3 -c 192.0.2.10 -t 30 -O 3 -P 4
iperf3 -c 192.0.2.10 -t 30 -O 3 -P 4 -R
Replace 192.0.2.10 with that machine's address. -P 4 runs four parallel streams, -R makes the far end send, -O 3 omits the first three seconds of TCP slow start.
Do not expect 1,000 Mbit/s on a 1 Gbps port. RFC 6349 counts each full-size Ethernet frame as 1,538 bytes on the wire: 1,500 bytes of packet, 14 of Ethernet header, 4 of CRC, 12 of inter-frame gap, 7 of preamble and 1 of start-of-frame delimiter. That allows 1,000,000,000 ÷ (1,538 × 8) = 81,274 frames a second. Subtract 20 bytes of IPv4 header and 20 of TCP header and each frame carries 1,460 bytes of data, so the ceiling is 81,274 × 1,460 × 8 = 949.3 Mbit/s (RFC 6349's table gives 949.2).
Linux enables TCP timestamps by default, and the option layout RFC 7323 recommends takes 12 bytes of every segment, so payload drops to 1,448 bytes: 81,274 × 1,448 × 8 = 941.5 Mbit/s. A result close to 941 is the port at full speed. For 10 Gbps, RFC 6349's 812,743 frames a second give 9,414.8 Mbit/s. Over IPv6 (40-byte header) expect about 928 Mbit/s per 1 Gbps.
A public iperf3 server proves little: the slowest link on the path, its port and other testers included, caps the result. Test against a machine with a port at least as fast as yours, both directions, at different times of day. Whether 1 Gbps is enough: how much bandwidth a server needs.
6. The 24 to 72 hour burn-in
Short tests find dead parts; a burn-in finds marginal ones, like a DIMM that errs only when warm. Run CPU and memory load together:
sudo systemctl enable --now rasdaemon
sudo stress-ng --cpu 0 --vm 2 --vm-bytes 75% --verify --tz --metrics-brief --timeout 24h --log-file /root/burnin.log
--verify checks memory contents and tags failures fail; --vm-bytes 75% is shared by both memory workers. Use 24 hours minimum, 72 for a server that will hold production data for years. Then:
grep -i fail /root/burnin.log
sudo journalctl -k | grep -i -E 'mce|edac|hardware error'
Re-read the EDAC counters and SMART: any increase over day one is a finding.
Record it, and what to do if something is off
| Test | Command | Good looks like |
|---|---|---|
| CPU | lscpu |
Model, sockets, cores as ordered |
| RAM | dmidecode -t memory |
Sizes sum to the order; speed per spec |
| Disks | lsblk, nvme list |
Count, size, model as ordered |
| Disk health | smartctl -x / -a |
Passed; Critical Warning 0; no media errors |
| Disk speed | fio 4k and 1M reads |
Near the drive's datasheet |
| Thermals | turbostat, sensors |
Clock holds as temperature settles |
| ECC | EDAC ce_count, ue_count |
0 before and after burn-in |
| Network | iperf3 -P 4, with -R |
About 941 Mbit/s per 1 Gbps |
| Burn-in | stress-ng --verify |
No fail lines, no new kernel errors |
If a line fails, open a ticket that day with the command, its raw output and what you ordered; a fio report beside the datasheet figure beats "the disk is slow". Keep the files as your baseline.
Choosing the server you will test
NexonHost's dedicated servers start at €129 a month (2× Xeon E5-2630 v4, 128 GB, 240 GB SATA SSD, 1 Gbps port, provisioned in minutes); the EPYC 9254 at €449 has 2× 1 TB NVMe in RAID 1 and takes about two weeks. Ports are unmetered, so a long iperf3 run costs nothing extra, and every build includes 100 Gbps Layer 4 DDoS protection. A 10 Gbps dedicated server port is €500 a month on Xeon, €800 on the EPYC 9254, in place of the 1 Gbps port (€50 and €80); expect about 9,415 Mbit/s. To benchmark a dedicated server you need it for a few days: start on a one-month term, run all six steps in week one, and contact us with the output if anything misses spec.
Prices as of 9 November 2026, EUR ex VAT, a month; the store preselects a 1 TB backup add-on at €5 a month extra. Check the product page.
Sources
- fio documentation — direct, iodepth, ioengine (libaio), rw, time_based, allow_mounted_write, --readonly, retrieved 9 November 2026
- smartctl(8) manual, smartmontools repository — -a vs -x for ATA, -H meaning, -d megaraid,N, NVMe SMART/Health log, NVMe self-test in 7.4, retrieved 9 November 2026
- NVM Express Base Specification 2.1, Figure 206 — SMART / Health Information log page fields, retrieved 9 November 2026
- iperf3 documentation, ESnet — invoking iperf3: -s, -c, port 5201, -P, -R, -O, -t, retrieved 9 November 2026
- RFC 6349, Framework for TCP Throughput Testing — 1,538-byte frame, 1,460-byte payload, 949.2 Mbit/s for GigE, retrieved 9 November 2026
- RFC 7323, TCP Extensions for High Performance — timestamps option layout (NOP, NOP, 10-byte option), retrieved 9 November 2026
- Linux kernel documentation, IP sysctl — tcp_timestamps default 1, retrieved 9 November 2026
- sysbench README and source — cpu and memory tests, --threads, --time, --memory-block-size, --memory-total-size, retrieved 9 November 2026
- stress-ng manual — --cpu 0, --vm-bytes, --verify, --tz, --metrics-brief, --timeout, retrieved 9 November 2026
- turbostat(8), Linux kernel tools — Busy%, Bzy_MHz, PkgTmp, PkgWatt, retrieved 9 November 2026
- Linux kernel documentation, Reliability, Availability and Serviceability — EDAC, corrected and uncorrected errors, ce_count/ue_count, retrieved 9 November 2026
- rasdaemon documentation — running under systemd, ras-mc-ctl changes after 0.8.5, retrieved 9 November 2026
- lm-sensors — the sensors tool, retrieved 9 November 2026
- Memtest86+ — stand-alone memory tester, retrieved 9 November 2026
- nvme-cli documentation — nvme list, device-self-test (-s 2 = extended), self-test-log, retrieved 9 November 2026
- Debian manpages — turbostat(8) in package linux-cpupower, retrieved 9 November 2026
- Ubuntu package contents search — turbostat in linux-tools-common and the versioned linux-tools packages (noble), retrieved 9 November 2026
- NexonHost store configurator and product pages — builds, prices, port options, delivery times, backup add-on, retrieved 9 November 2026
- Computed — 1,500 + 14 + 4 + 12 + 7 + 1 = 1,538; 1,000,000,000 ÷ (1,538 × 8) = 81,274; 1,500 − 20 − 20 = 1,460; 81,274 × 1,460 × 8 = 949.3 Mbit/s; 1,460 − 12 = 1,448; 81,274 × 1,448 × 8 = 941.5 Mbit/s; 10,000,000,000 ÷ (1,538 × 8) = 812,743; 812,743 × 1,448 × 8 = 9,414.8 Mbit/s; IPv6: 1,500 − 40 − 20 − 12 = 1,428; 81,274 × 1,428 × 8 = 928.5 Mbit/s